
You’re already investing time and money to get people to your website. Whether visitors come from Google, AI search, social media, paid ads, or email campaigns, every click costs something.
Then they land on your page… and disappear.
No purchase. No form submission. No newsletter signup. They simply leave, and you’re left wondering what went wrong.
- Was your headline confusing?
- Did your form scare them off with too many fields?
- Did they never even scroll far enough to see your “Buy Now” button?
You’re flying blind, and flying blind is expensive.
Businesses typically spend around $92 to bring a single visitor to their site, but only about $1 trying to actually convert that visitor once they arrive.
That gap is exactly the problem conversion rate optimization (CRO) tools exist to close.
And TruConversion is one of the platforms built specifically to help you see what’s happening after the click, not just how many people showed up, but what they did, where they got stuck, and why they left.
Before you hand over your card details for a 14-day trial, let’s break down exactly what each TruConversion plan gives you, backed by real numbers on why this kind of tool matters in the first place.
So let’s get started,
TL;DR: TruConversion Pricing
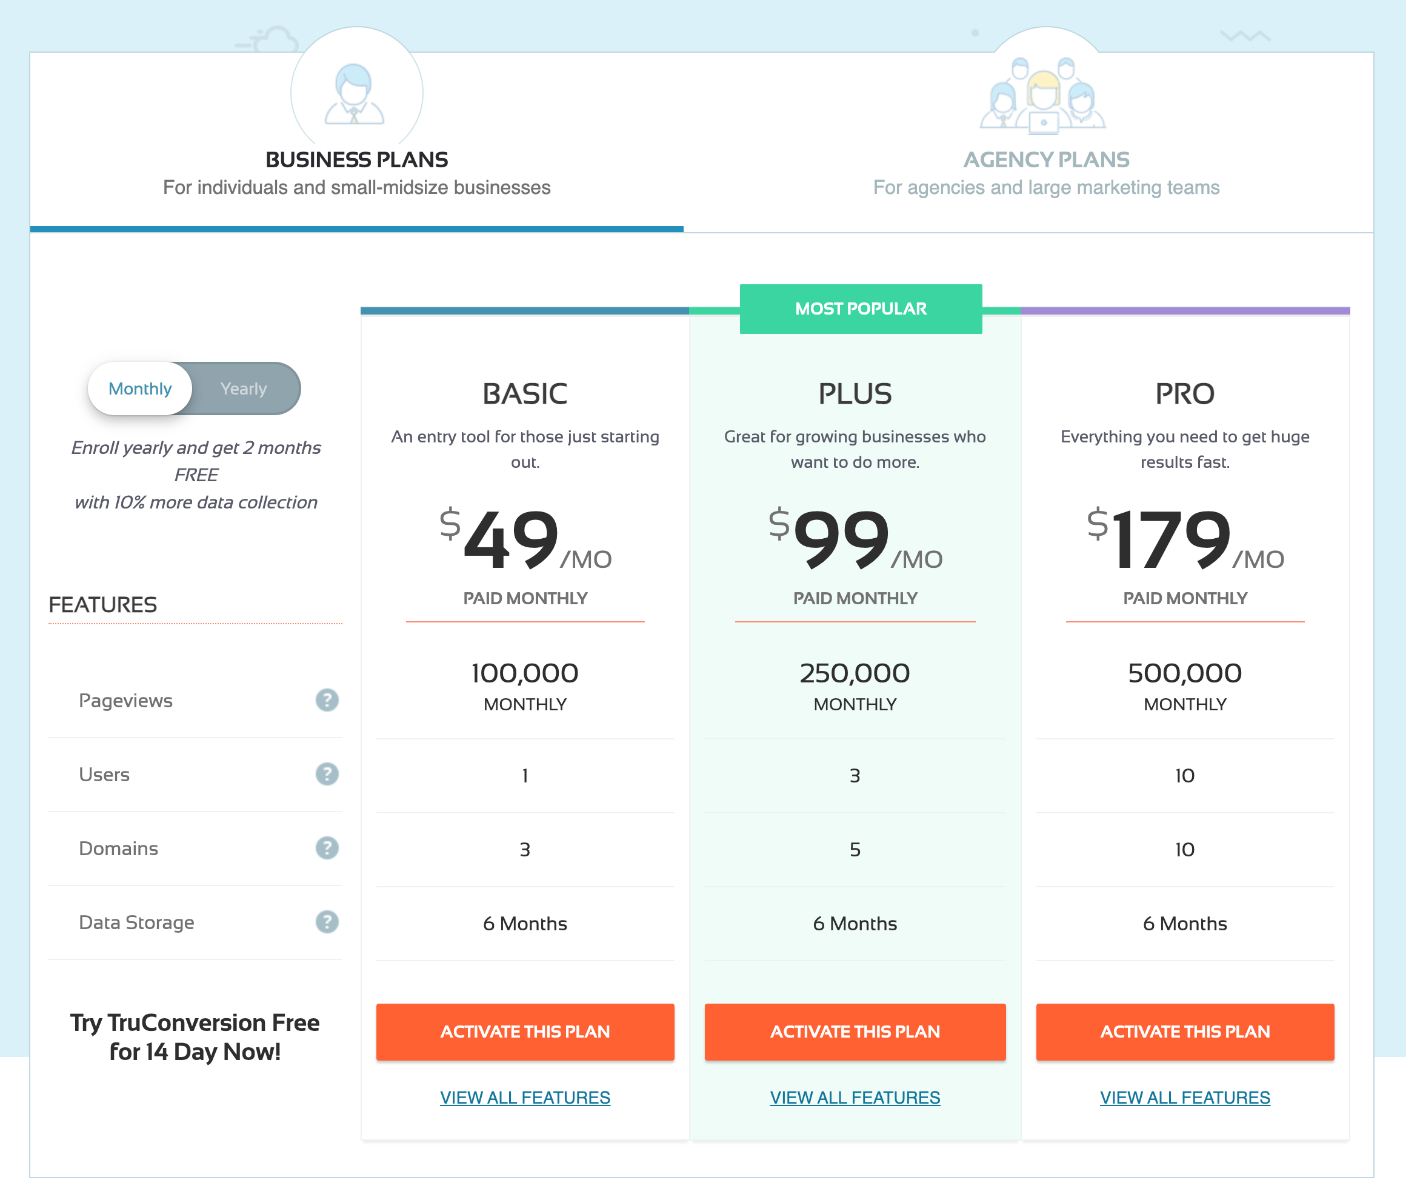
- Every plan includes heatmaps, session recordings, funnels, form analytics, microsurveys, and surveys. You will get every single explanation in this article.
- The TruConversion pricing difference is how much traffic and how many websites you can manage.
- Data storage for every plan is 6 months.
- Business plans are ideal for individuals and growing companies, while Agency plans are designed for teams managing multiple client websites.
| Plan | Best For | Monthly Price | Yearly Price* | Monthly Pageviews | Users | Domains |
|---|---|---|---|---|---|---|
| Basic | Solo founders and new websites | $49 /month | $492 /year | 100,000 | 1 | 3 |
| Plus | Growing small and mid-sized businesses | $99 /month | $996 /year | 250,000 | 3 | 5 |
| Pro | High-traffic businesses and in-house teams | $179 /month | $1,788 /year | 500,000 | 10 | 10 |
| Agency Basic | Small agencies with a few client websites | $490 /month | $4,896 /year | 1,000,000 | 30 | 30 |
| Agency Plus | Growing agencies managing multiple clients | $990 /month | $9,900 /year | 2,500,000 | 50 | 50 |
| Agency Pro | Large agencies and enterprise marketing teams | $1,790 /month | $17,904 /year | 5,000,000 | 100 | 100 |
- Yearly billing includes 2 months free and 10% more monthly data collection compared to monthly billing.
- Final Verdict: You don’t have to pay what you see. If you buy TruConversion from Appsumo, you will get it for life at an affordable price of $79 (limited-time offer)
- Remember: The Appsumo deal is not available all the time. If TruConversion owners want to remove it from Appsumo, you have to purchase it from their website at full price, which is expensive.
What Is TruConversion?
TruConversion is a conversion rate optimization (CRO) platform that shows how visitors interact with your website, including where they click, scroll, and drop off.
For example, your product page gets plenty of visitors, but very few people click “Add to Cart.” A TruConversion heatmap will show that visitors are clicking on the product image instead of the button because they expect it to open a gallery.
Once you spot the problem, you can make the image clickable or move the “Add to Cart” button higher on the page.
TruConversion Package Comparison According to Features
| Core Features | Basic ($49/mo) | Plus ($99/mo) (Including All Basic) | Pro ($179/mo) (Including All Plus) |
|---|---|---|---|
| Heatmaps | ✓ Click Map ✓ Move Map ✓ Scroll Map | ✓ Share Heatmap ✓ Download Heatmap ✓ JavaScript Triggers | ✓ Detail Map ✓ Compare Heatmap |
| Heatmap Filters | ✓ Date Range ✓ Source of Visitor | ✓ Operating System ✓ Browser | ✓ Campaign ✓ Country |
| Recordings | ✓ IP Address ✓ Country ✓ Device Type ✓ Operating System ✓ Browser ✓ Date | ✓ Recording Event ✓ JavaScript Triggers ✓ Tagging ✓ Share Recordings | ✓ Trend Report |
| Recording Filters | ✓ Date Range ✓ Page URL ✓ Device | ✓ Browser ✓ Operating System ✓ Tags ✓ Events ✓ Session Length ✓ Country ✓ Campaign | ✓ Operating System Version ✓ City ✓ Browser Version ✓ Locale ✓ # of pages ✓ Screen Width ✓ Screen Height ✓ Search Engine ✓ Search Keywords |
| Funnels | N/A | ✓ Funnel Branching ✓ Heatmap & Recording Trigger ✓ Share Funnels | ✓ Funnel Events |
| Funnel Filters | ✓ Date Range ✓ Page URL ✓ Device | ✓ Browser ✓ Operating System ✓ Country ✓ Campaign | ✓ Operating System Version ✓ City ✓ Browser Version ✓ Locale ✓ Screen Width ✓ Screen Height ✓ Search Engine ✓ Search Keywords |
| Forms | N/A | ✓ Share Forms | ✓ Share Forms |
| Form Filters | ✓ Date Range ✓ Page URL ✓ Device | ✓ Browser ✓ Operating System ✓ Country ✓ Campaign | ✓ Operating System Version ✓ City ✓ Browser Version ✓ Locale ✓ Screen Width ✓ Screen Height ✓ Search Engine ✓ Search Keywords |
| Microsurveys | ✓ Page Load Trigger ✓ Scroll Trigger ✓ Direct Visitor | ✓ Share Microsurvey ✓ CRM/ESP Integration ✓ Remove Branding ✓ Delayed Trigger ✓ Target Return Visitor ✓ Multi-page consumption ✓ Exclude Browser | ✓ Insert Own Branding ✓ Abandon Page Trigger ✓ Referral Visitors ✓ Search Engine Referrals ✓ Identity Targeting |
| Microsurvey Filters | ✓ Date Range ✓ Page URL ✓ Device | ✓ Browser ✓ Operating System ✓ Country ✓ Campaign | ✓ Operating System Version ✓ City ✓ Browser Version ✓ Locale ✓ Screen Width ✓ Screen Height ✓ Search Engine ✓ Search Keywords |
| Surveys | ✓ Page Load Trigger ✓ Scroll Trigger | ✓ Share Survey ✓ Remove Branding ✓ Delayed Trigger | ✓ Insert Own Branding ✓ Abandon Page Trigger |
| Survey Filters | ✓ Date Range ✓ Page URL ✓ Device | ✓ Browser ✓ Operating System ✓ Country ✓ Campaign | ✓ Operating System Version ✓ City ✓ Browser Version ✓ Locale ✓ Screen Width ✓ Screen Height ✓ Search Engine ✓ Search Keywords |
What are Heatmaps in TruConversion
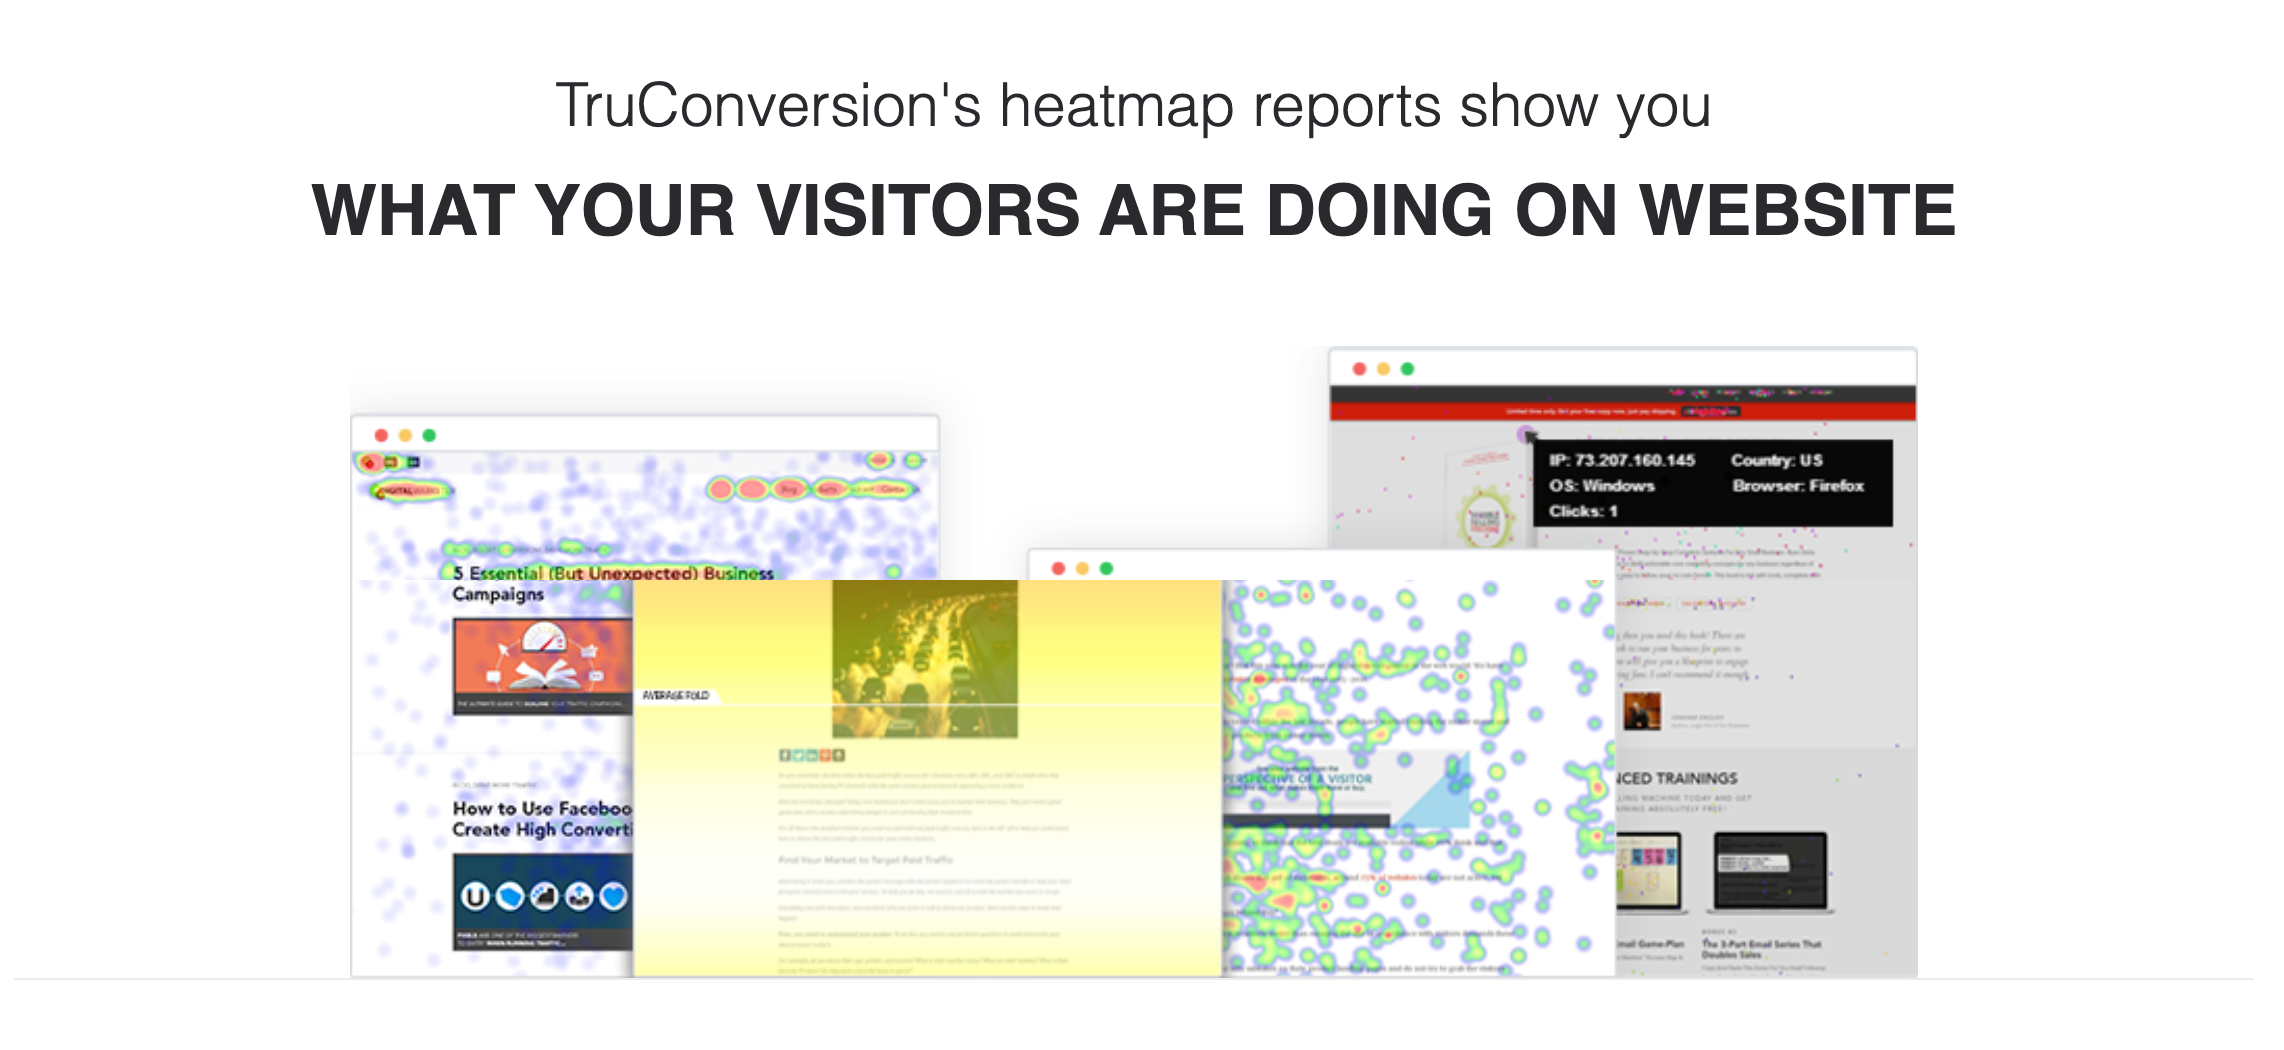
Heatmaps in TruConversion are visual reports that show exactly how visitors interact with your website.
- They reveal where people click,
- how far they scroll,
- and which parts of a page get the most or least attention.
The real value isn’t seeing colorful hotspots on a page. It’s finally understanding why visitors aren’t converting.
- Maybe everyone is clicking an image that isn’t clickable.
- Maybe your call-to-action sits below the point where most visitors stop scrolling.
- Or maybe an important section of your page is being completely ignored.
Instead of guessing, you can see what’s actually happening and make changes with confidence.
For example, your landing page gets plenty of visitors, but very few people sign up. A heatmap shows they’re clicking the pricing table instead of your “Start Free Trial” button.
What You’ll Get in TruConversion Heatmaps
- Click Map: See exactly where visitors click on your page. This helps you identify which buttons, links, and elements attract the most attention.
- Move Map: Track how visitors move their mouse across the page. It’s a great way to understand which sections people are paying attention to before they click.
- Scroll Map: Find out how far visitors scroll before they leave. You’ll know whether important content or CTAs are being seen.
- Share Heatmap: Share heatmap reports with teammates or clients using a link. Everyone can review the same data without taking screenshots.
- Download Heatmap: Export heatmaps as images for reports or presentations. It’s useful for documenting findings and sharing insights.
- Detail Map: View detailed click data for every page element. This makes it easier to understand exactly how visitors interact with specific buttons, links, or images.
- Compare Heatmap: Compare visitor behavior across different date ranges or page versions. You’ll quickly see whether your design changes improved engagement.
- JavaScript Triggers: Record heatmaps only after specific visitor actions or events. This gives you more accurate data for dynamic pages and interactive elements.
- Advanced Filters: Filter heatmap data by Date Range, Source of Visitor, Operating System, Browser, Campaign, and Country. This helps you understand how different audience segments behave on the same page.
Heatmaps Filters
- Date Range: View heatmaps from a specific time period. Compare visitor behavior before and after changing your page layout or running a campaign.
- Source of Visitor: See how visitors from Google, social media, email, or paid ads interact with your page. This helps you understand which traffic sources engage the most.
- Operating System: Filter heatmaps by operating system, such as Windows, macOS, Android, or iOS. You can identify layout or usability issues that affect specific devices.
- Browser: View heatmaps for different browsers like Chrome, Safari, Firefox, or Edge. This makes it easier to spot browser-specific interaction patterns.
- Campaign: Analyze heatmaps for visitors from a specific marketing campaign. See whether campaign traffic clicks, scrolls, and engages differently from other visitors.
- Country: Filter heatmaps by visitor location. Compare how users from different countries interact with the same page to uncover regional behavior patterns.
What Are Recordings in TruConversion?
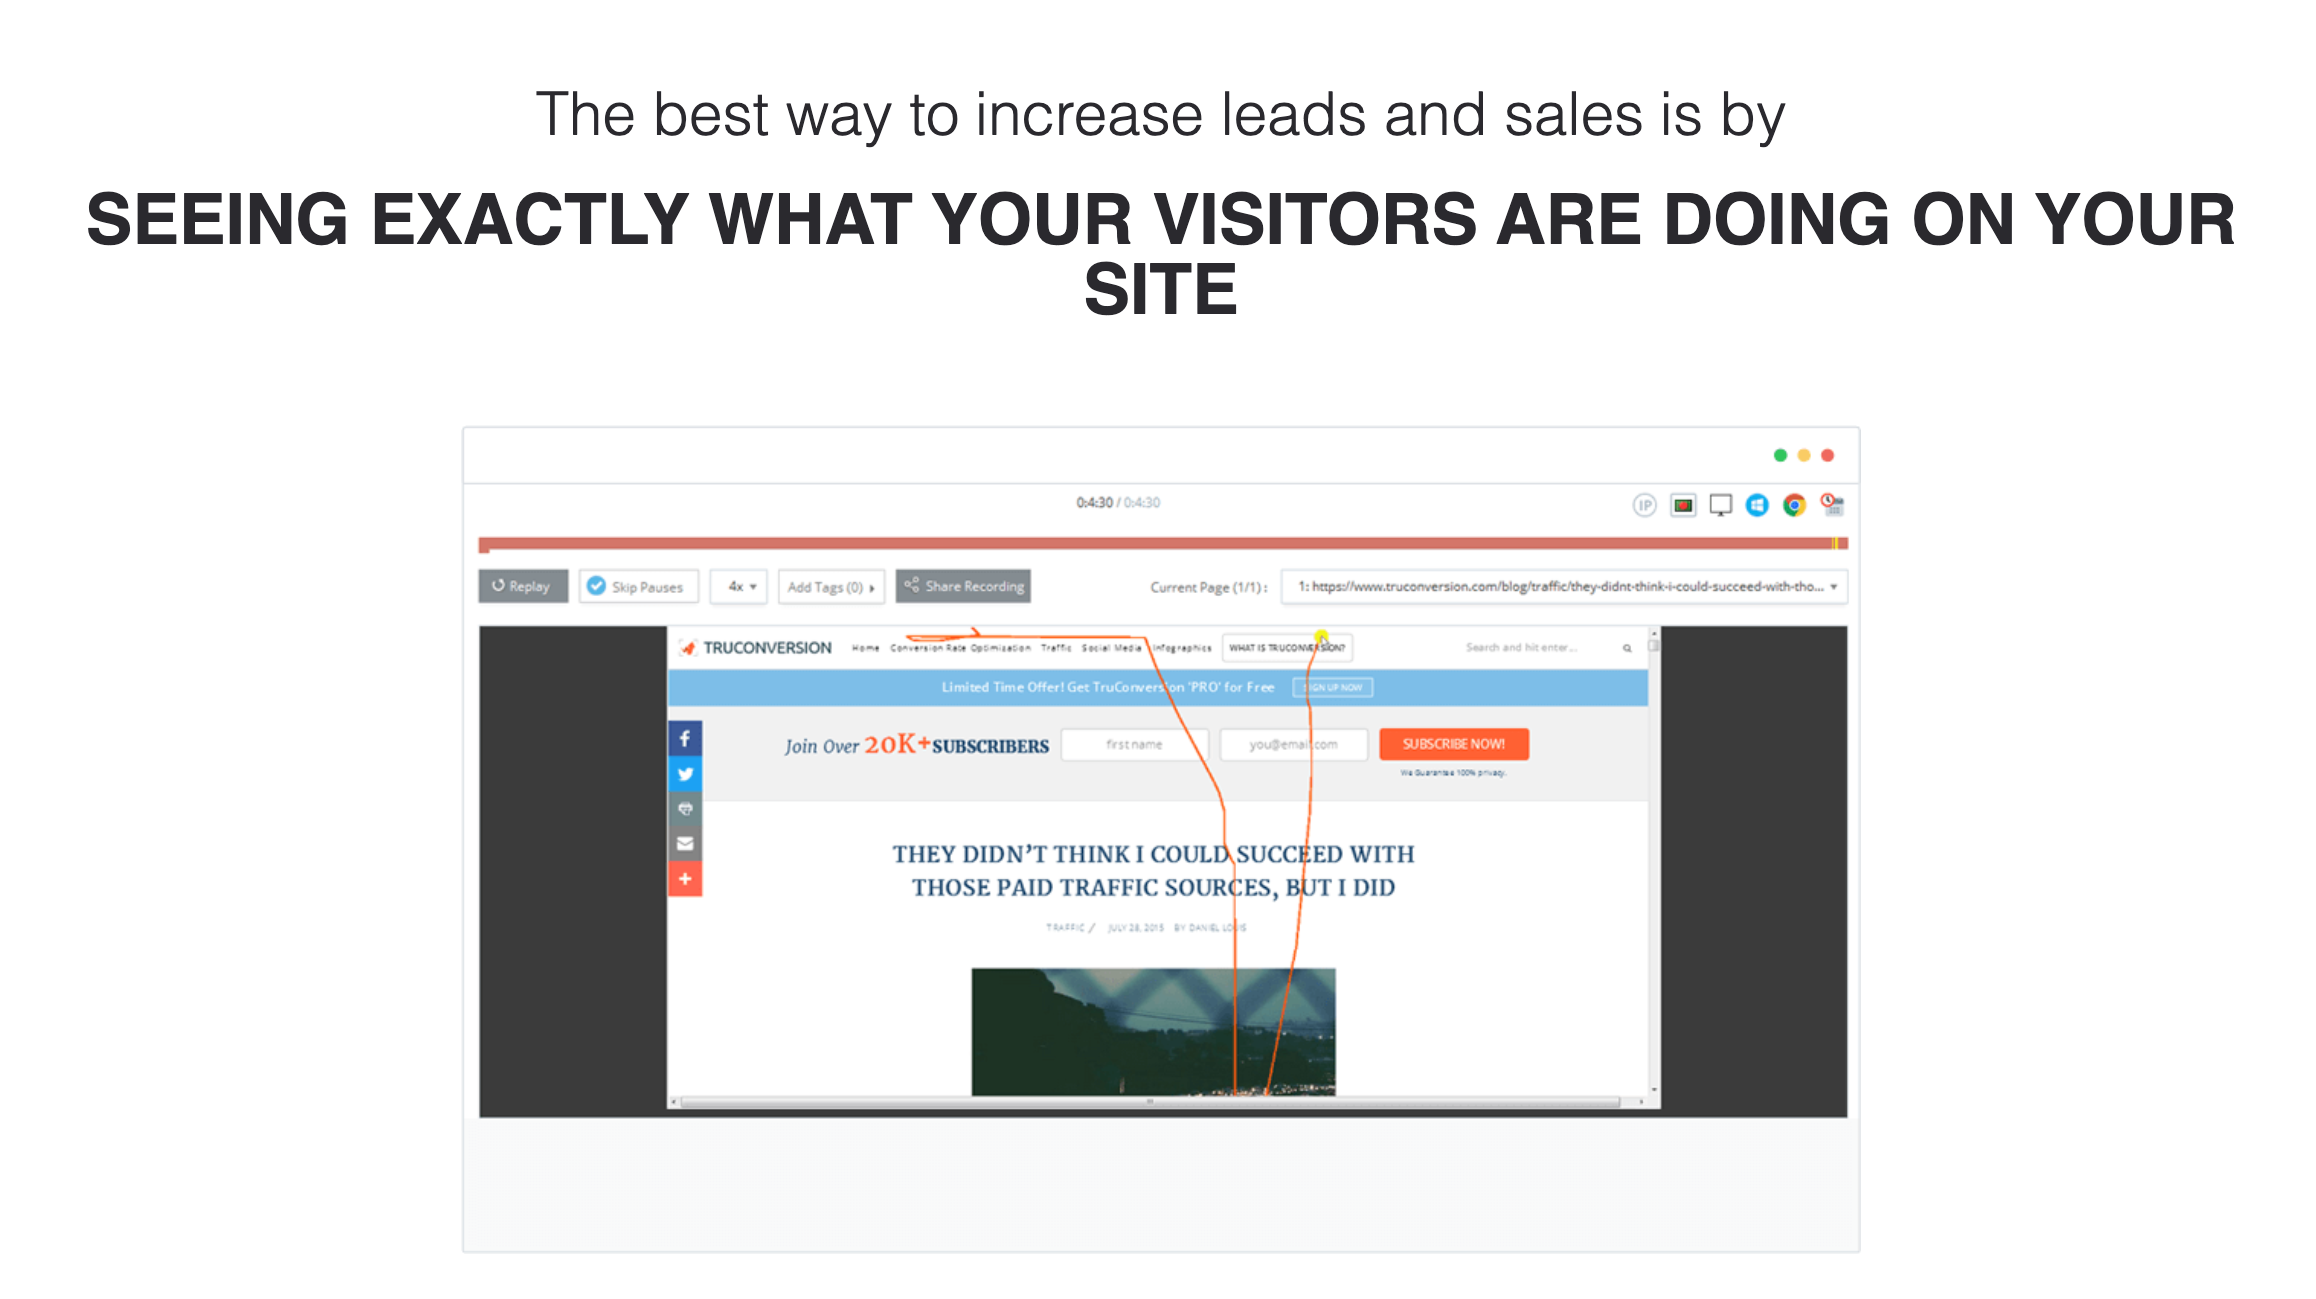
Recordings in TruConversion let you replay real visitor sessions on your website. Instead of looking at charts and numbers, you can watch exactly
- how people navigate your pages,
- where they hesitate,
- what they click,
- and where they leave.
The real value isn’t just watching visitor sessions. It’s discovering the friction that’s stopping people from converting.
- Maybe visitors keep moving their mouse around because they can’t find your pricing.
- Maybe they repeatedly click a button that isn’t working.
- Or maybe they abandon your checkout after getting stuck on a specific step.
Instead of guessing what went wrong, you can watch the entire journey and identify exactly where the experience breaks down.
For example, A visitor reaches your checkout page but leaves without completing the purchase.
A session recording shows they repeatedly click the “Apply Coupon” button before abandoning the page. It helps you uncover a usability issue that analytics alone wouldn’t reveal.
What You’ll Get in TruConversion Recordings
- IP Address: Identify the IP address of each visitor session. This helps you distinguish unique visitors and investigate suspicious activity.
- Country: See which country each visitor comes from. You’ll understand how users from different regions navigate your website.
- Device Type: Find out whether visitors are using a desktop, tablet, or mobile device. This helps you identify device-specific usability issues.
- Operating System: View the operating system used during each session. You can quickly spot issues affecting Windows, macOS, Android, or iOS users.
- Browser: See which browser visitors use while browsing your site. This makes it easier to troubleshoot browser-specific problems.
- Date: Know exactly when each recording took place. You can review sessions during a specific period or after publishing changes.
- Recording Event: Capture recordings based on specific visitor actions or events. This helps you focus on the sessions that matter most.
- JavaScript Triggers: Start recordings only after a custom JavaScript event occurs. It’s ideal for tracking interactions on dynamic pages and web applications.
- Tagging: Organize recordings with custom tags. This makes it easier to group and revisit important sessions later.
- Share Recordings: Share session recordings with teammates or clients using a link. Everyone can review the same visitor journey without logging into your account.
- Trend Report: View recording trends over time to identify recurring behavior patterns. This helps you measure whether user experience improves after making changes.
Recording Filters
- Date Range: View recordings from a specific time period. Compare visitor sessions before and after making website updates.
- Page URL: Filter recordings for a specific page. Focus only on the pages you want to optimize.
- Device: Watch sessions from desktop, tablet, or mobile users. This helps you identify device-specific issues.
- Browser: Filter recordings by browser. See whether Chrome, Safari, Firefox, or Edge users experience different problems.
- Operating System: Segment recordings by operating system. Discover issues affecting users on specific platforms.
- Tags: Filter recordings using your custom tags. Quickly find sessions you’ve already categorized.
- Events: View recordings that include specific visitor events. This helps you analyze key interactions without watching every session.
- Session Length: Filter recordings by session duration. Identify both highly engaged visitors and those who leave quickly.
- Country: Analyze recordings from visitors in a specific country. Compare browsing behavior across different regions.
- Campaign: View recordings from a particular marketing campaign. See how campaign traffic behaves after arriving on your website.
- Operating System Version: Filter sessions by OS version. This helps you identify compatibility issues with specific software versions.
- City: View recordings from visitors in a particular city. Understand local browsing behavior and regional trends.
- Browser Version: Filter sessions by browser version. Spot issues affecting users who haven’t updated their browsers.
- Locale: Analyze recordings based on a visitor’s language or regional settings. Ensure your website works well for international audiences.
- # of Pages: Filter visitors based on how many pages they viewed. Identify users who explored your website in depth.
- Screen Width: View recordings by screen width. This helps you optimize layouts for different screen sizes.
- Screen Height: Filter sessions by screen height. Check whether important content remains visible across different displays.
- Search Engine: View recordings from visitors who arrived through a specific search engine. Compare behavior between Google, Bing, and other search platforms.
- Search Keywords: Filter sessions by the keywords visitors searched before landing on your site. Understand whether search intent matches your page content.
What Are Funnels in TruConversion?
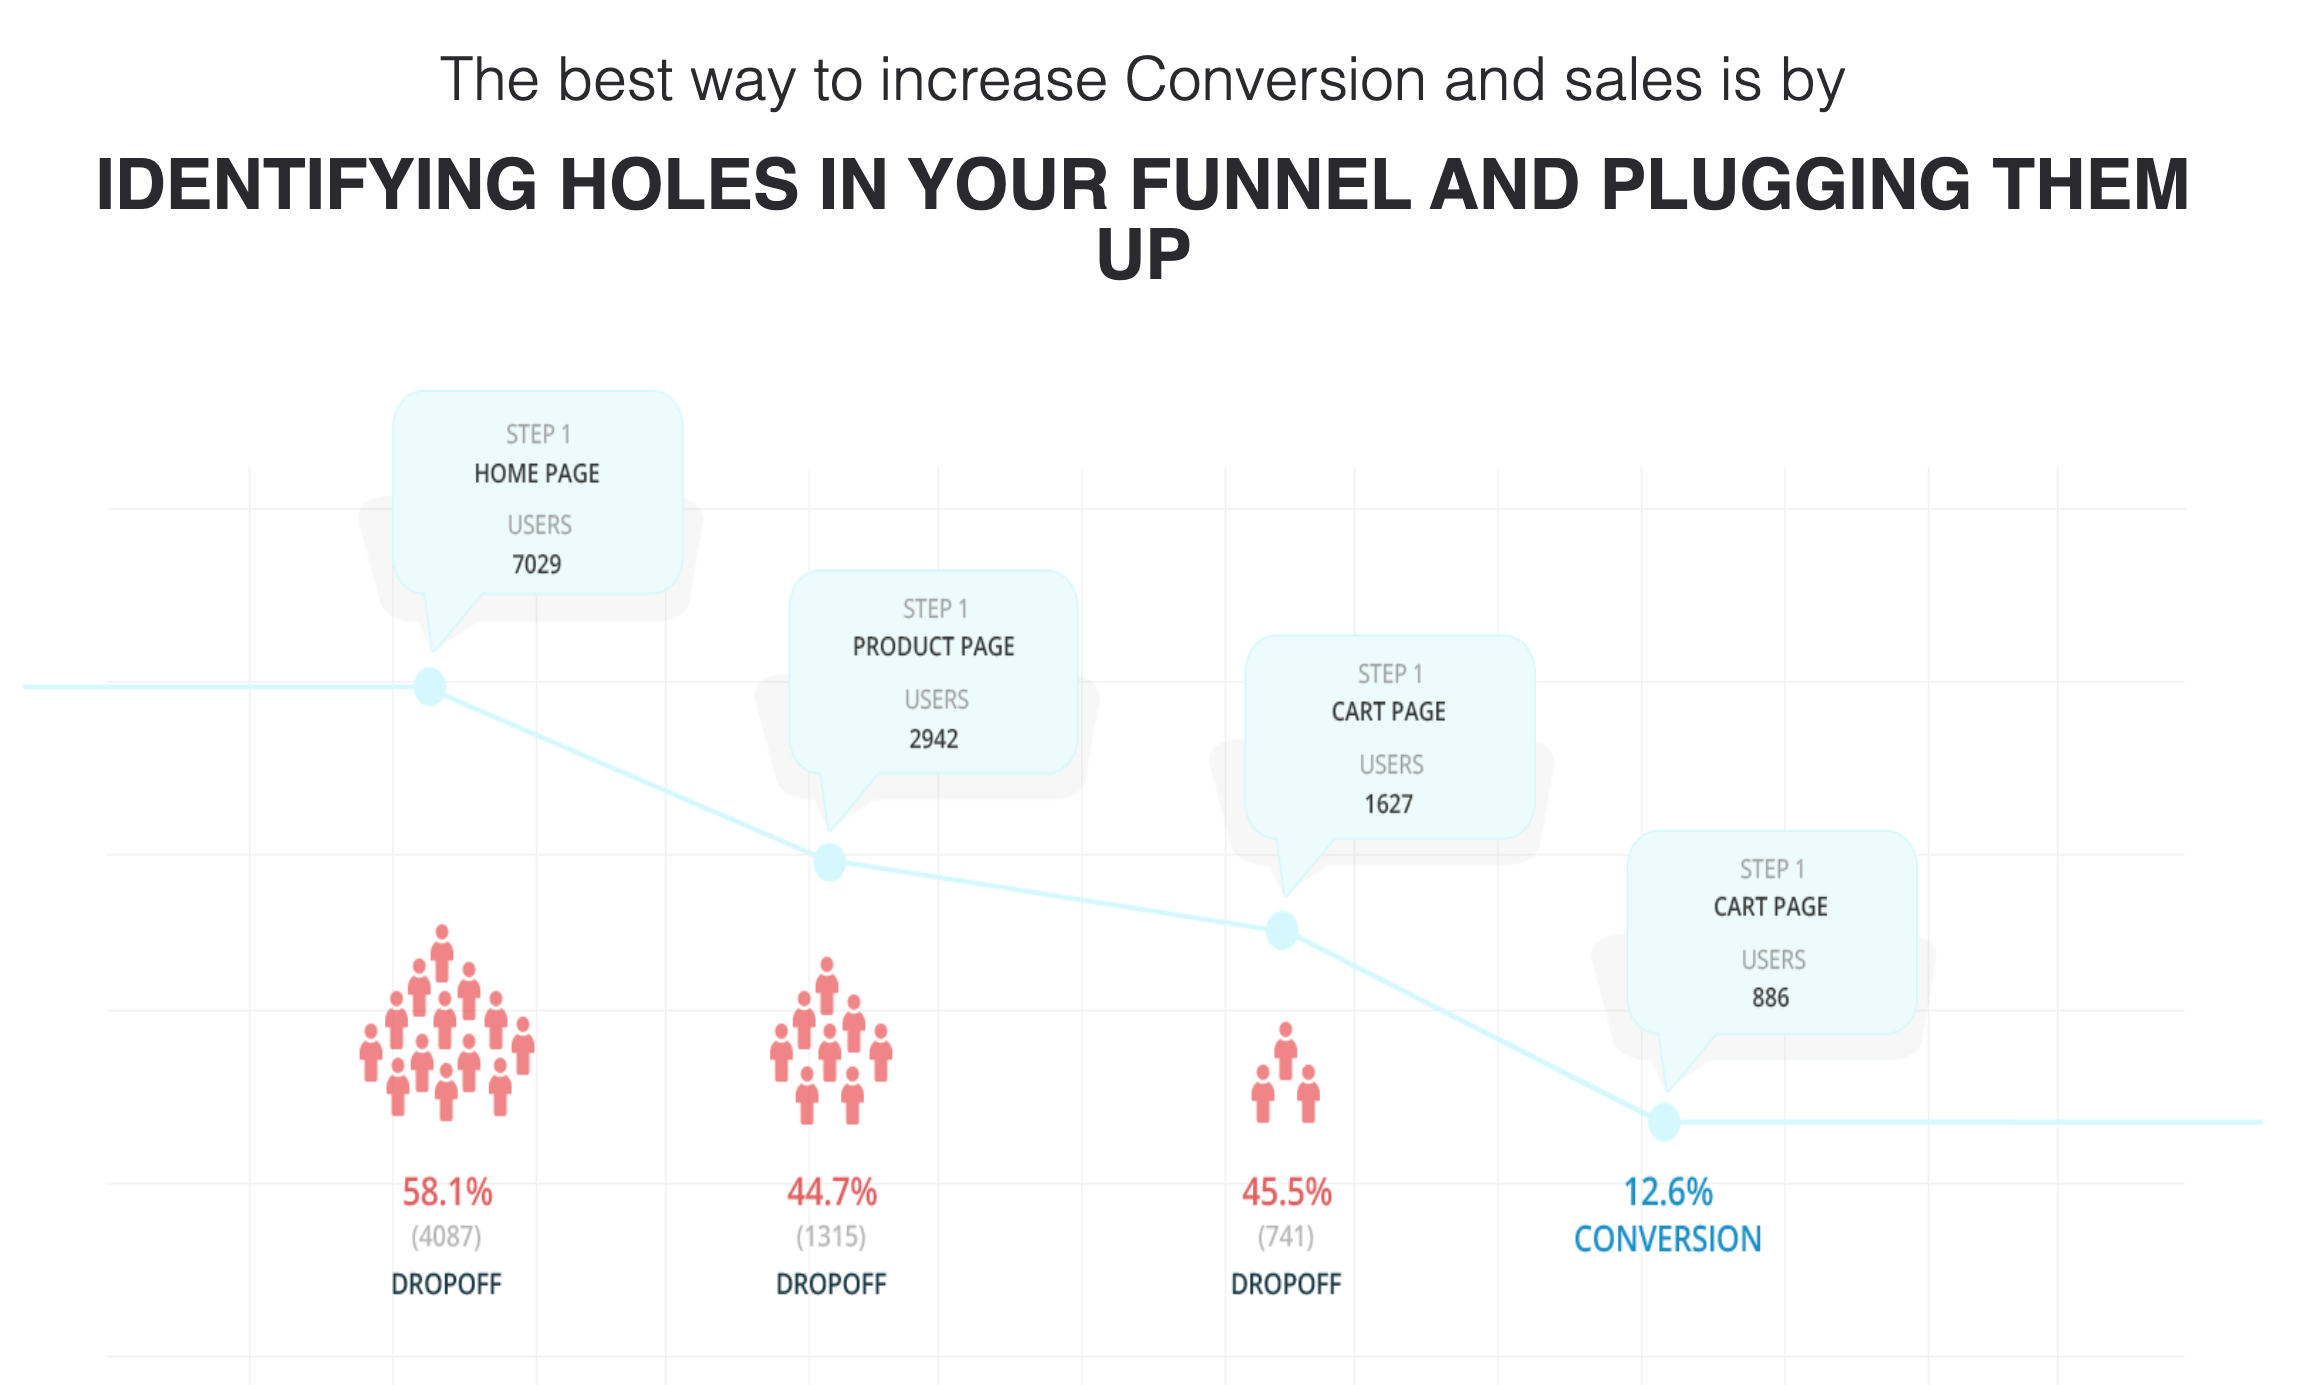
Funnels in TruConversion help you track every step visitors take before completing a goal, such as making a purchase, signing up, or submitting a form.
Instead of only seeing the final conversion rate, you can identify exactly where visitors drop off in the journey.
The real value isn’t knowing how many people converted. It’s understanding where you’re losing potential customers.
- Maybe visitors leave on the pricing page before reaching checkout.
- Maybe they abandon the signup process after creating an account.
- Or maybe one step in your funnel creates unnecessary friction.
Instead of guessing where people leave, you can pinpoint the exact step that’s hurting your conversions and optimize it.
For example, your signup funnel starts with 1,000 visitors, but only 150 create an account. A funnel report shows most visitors leave on the pricing page, giving you a clear place to optimize.
What You’ll Get in TruConversion Funnels
- Funnel Branching: Track multiple visitor paths within the same funnel. This helps you understand how different journeys affect conversions.
- Heatmap & Recording Trigger: Open heatmaps and session recordings directly from a funnel step. You can investigate why visitors abandon a specific stage.
- Share Funnels: Share funnel reports with teammates or clients. Everyone can review the same conversion data and collaborate on improvements.
- Funnel Events: Track custom events, such as button clicks, purchases, or form submissions, as steps in your funnel. This gives you a more accurate view of the customer journey.
Funnel Filters
- Date Range: View funnel performance for a specific time period. Compare conversions before and after making changes.
- Page URL: Filter funnels by a specific page. Focus your analysis on the pages that matter most.
- Device: Analyze conversions by desktop, tablet, or mobile users. Identify which devices have the highest drop-off rates.
- Browser: Compare funnel performance across different browsers. Spot browser-specific issues that impact conversions.
- Operating System: Filter funnels by operating system. Discover whether Windows, macOS, Android, or iOS users behave differently.
- Country: Analyze funnels for visitors from different countries. Compare conversion rates across your target markets.
- Campaign: Measure funnel performance for a specific marketing campaign. See which campaigns generate the highest-quality traffic.
- Operating System Version: Filter conversions by OS version. Identify compatibility issues affecting certain users.
- City: View funnel data for visitors from a specific city. Understand how local audiences move through your funnel.
- Browser Version: Analyze funnel performance by browser version. Detect problems caused by outdated browsers.
- Locale: Filter funnels by language or regional settings. Ensure visitors from different locales have a smooth experience.
- Screen Width: Compare funnel performance across different screen widths. Find layout issues affecting specific screen sizes.
- Screen Height: Filter funnel data by screen height. Check whether important content is visible on different displays.
- Search Engine: View funnel performance for visitors from different search engines. Compare how search traffic converts.
- Search Keywords: Analyze funnels by the keywords visitors searched before arriving. Understand which search queries lead to the highest conversions.
What Are Forms in TruConversion?
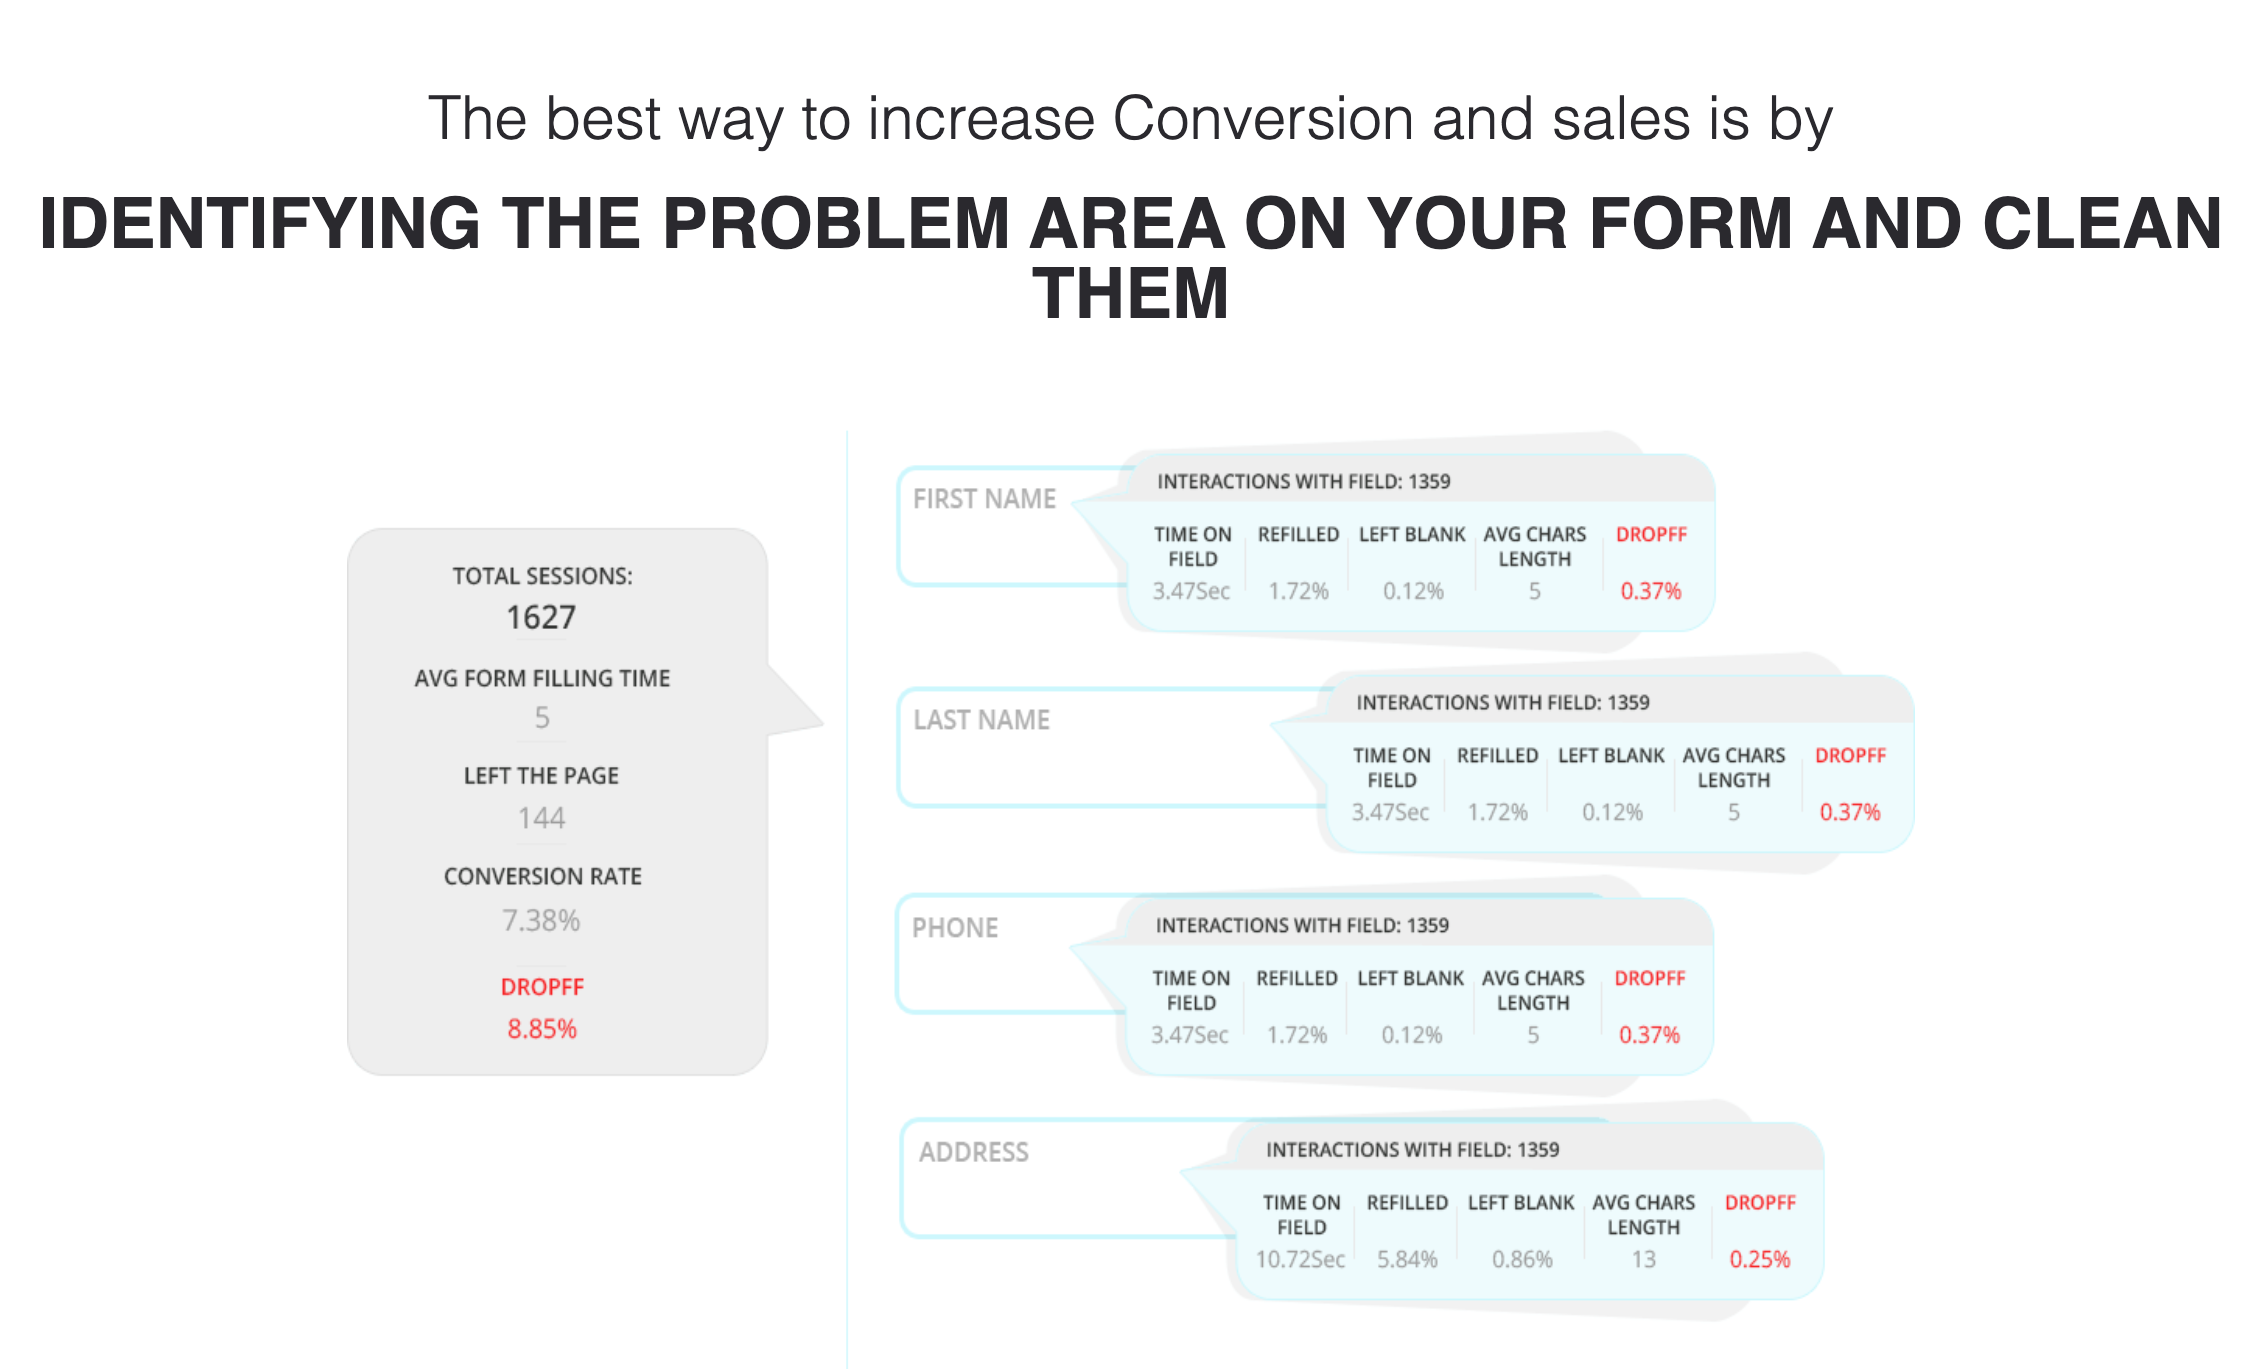
Forms in TruConversion help you understand how visitors interact with your website forms. Instead of only seeing completed submissions, you can identify where people hesitate, abandon the form, or stop filling it out.
The real value isn’t counting how many forms were submitted. It’s finding out why visitors don’t finish them.
Maybe your form asks for too much information. Maybe one required field is confusing. Or maybe visitors lose interest before they reach the Submit button.
Instead of guessing what’s causing low conversions, you can see where people drop off and make improvements that increase form completions.
For example, your contact form gets plenty of visitors, but very few submissions. Form analytics show that most users leave after reaching the Phone Number field, giving you a clear place to optimize.
What You’ll Get in TruConversion Forms
- Share Forms: Share form reports with teammates or clients using a link. Everyone can review the same form performance data and collaborate on improvements.
Form Filters
- Date Range: View form data for a specific time period. Compare form performance before and after making changes.
- Page URL: Filter reports for forms on a specific page. Focus on the forms you want to optimize.
- Device: Analyze form performance by desktop, tablet, or mobile users. Discover which devices have the highest abandonment rates.
- Browser: Compare form interactions across different browsers. Identify browser-specific issues affecting submissions.
- Operating System: Filter form data by operating system. See whether Windows, macOS, Android, or iOS users experience different results.
- Country: Analyze form submissions by visitor location. Compare completion rates across different countries.
- Campaign: View form performance for a specific marketing campaign. Understand which campaigns generate the most qualified leads.
- Operating System Version: Filter reports by OS version. Identify compatibility issues affecting certain users.
- City: Analyze form interactions by city. Discover how local audiences respond to your forms.
- Browser Version: Compare form performance by browser version. Spot issues affecting visitors using older browsers.
- Locale: Filter form data by language or regional settings. Ensure your forms perform well for international audiences.
- Screen Width: Analyze forms across different screen widths. Check whether your form layout works on every screen size.
- Screen Height: Filter reports by screen height. Make sure important fields and buttons remain visible.
- Search Engine: View form performance for visitors from different search engines. Compare which search sources generate the most submissions.
- Search Keywords: Analyze form conversions by the keywords visitors searched before landing on your page. Learn which search intent leads to the highest conversion rates.
What Are Microsurveys in TruConversion?
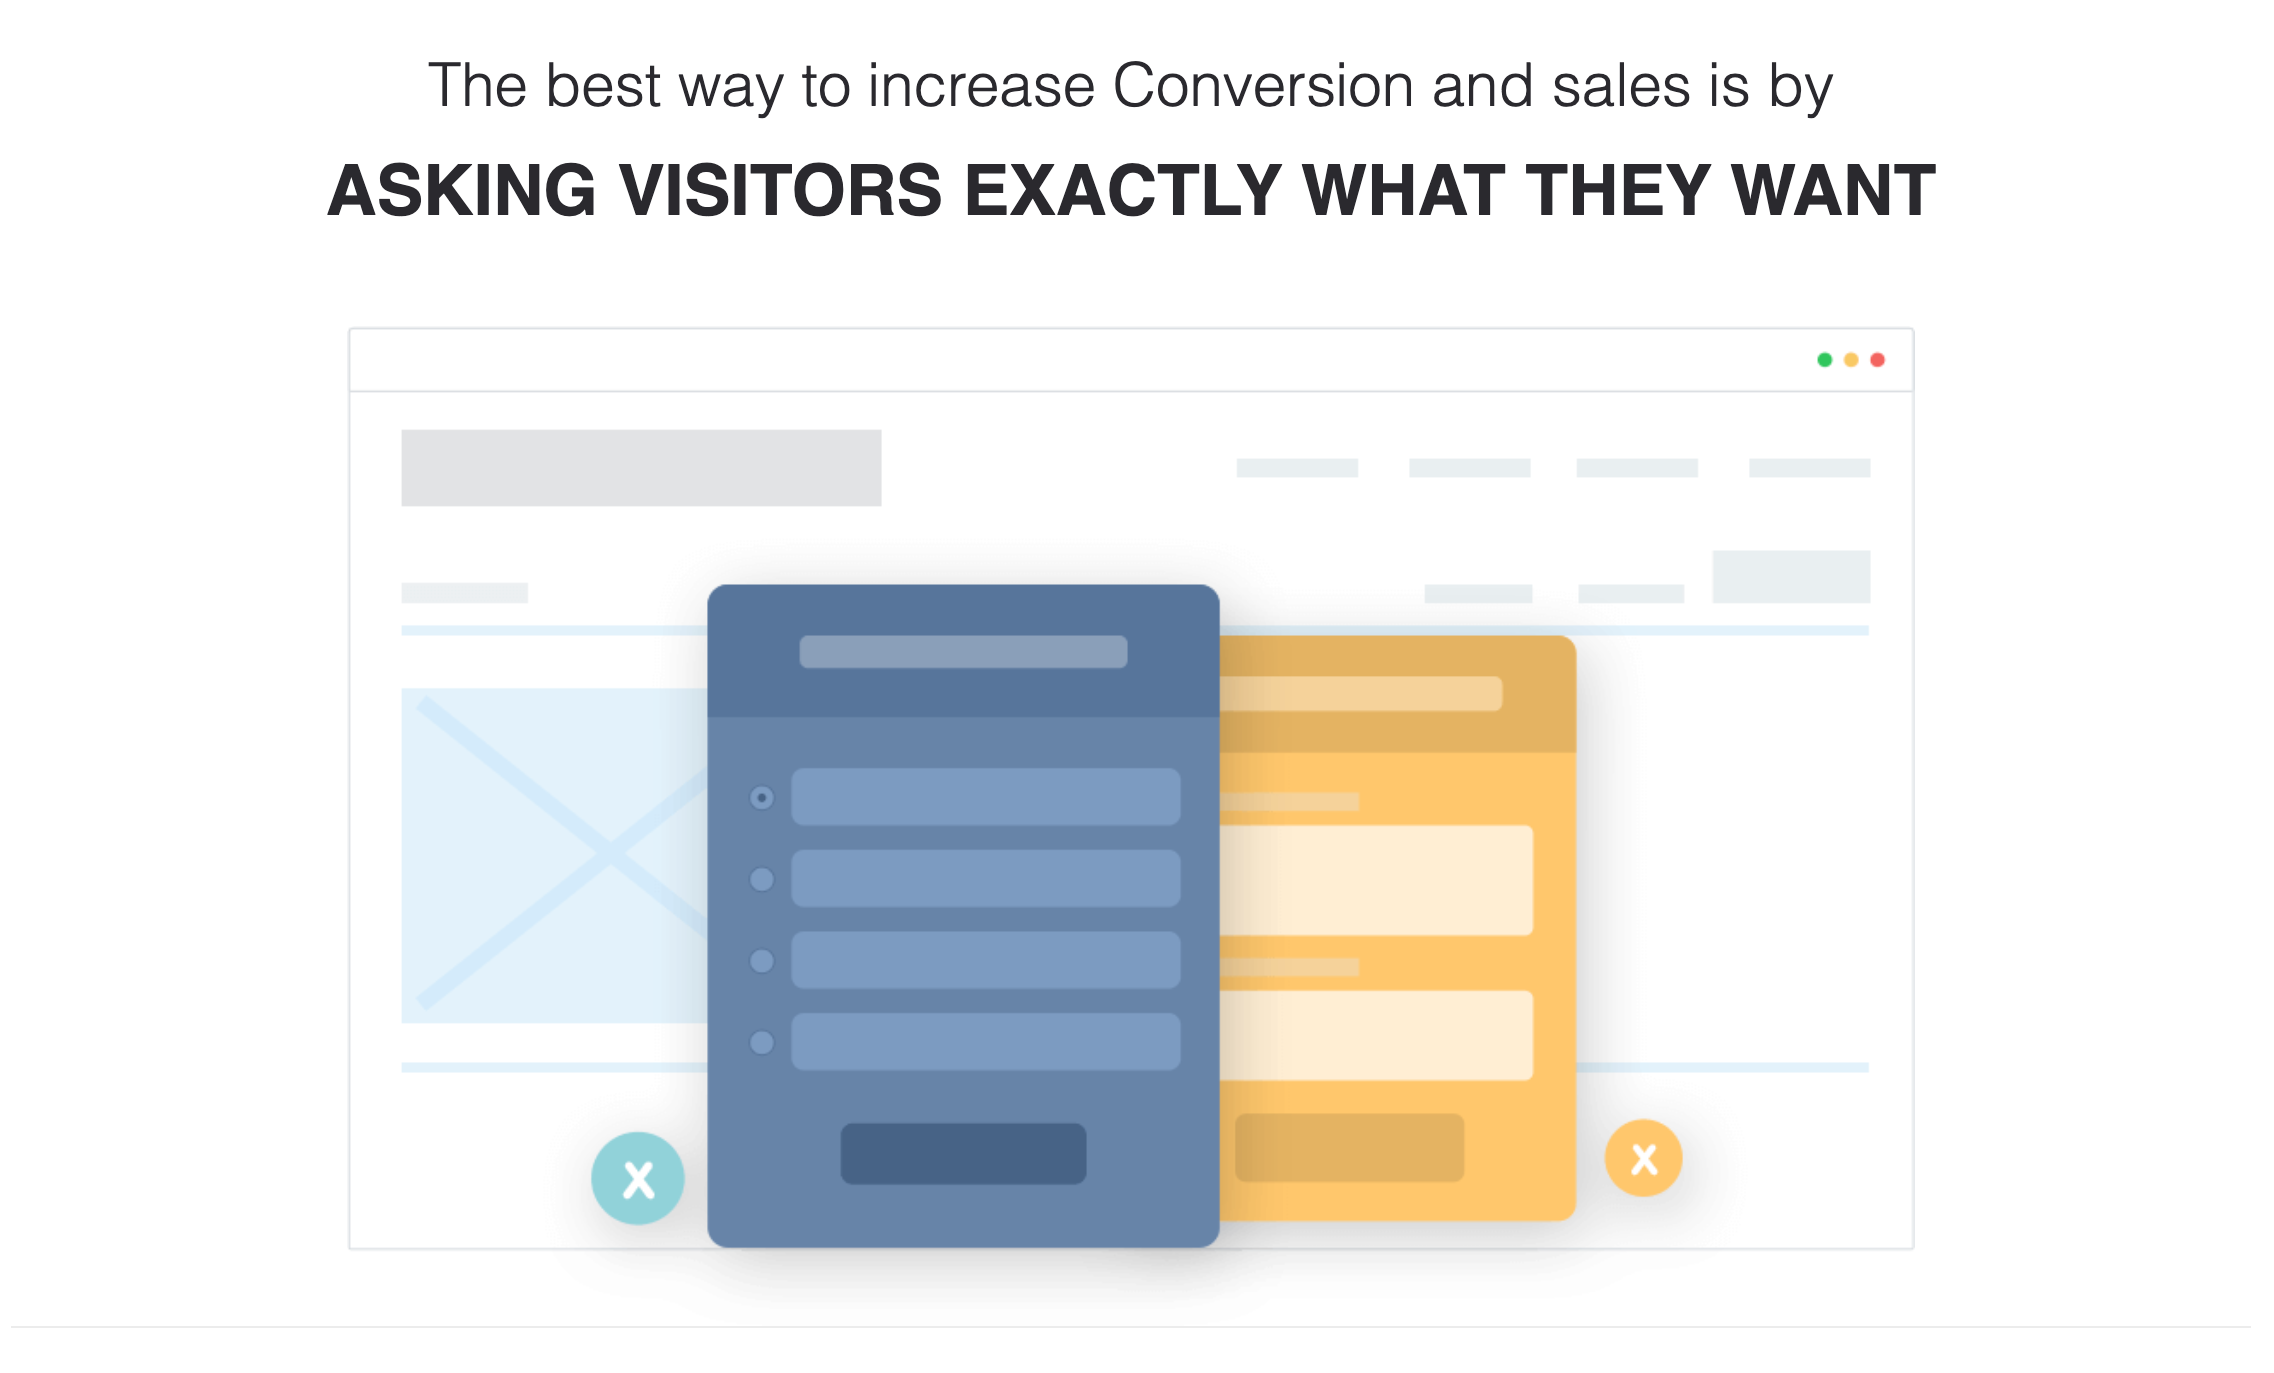
Microsurveys in TruConversion let you ask visitors short, targeted questions while they’re browsing your website.
Instead of guessing what users think, you can collect feedback at the exact moment they’re interacting with your pages.
The real value isn’t collecting more survey responses. It’s understanding why visitors behave the way they do.
- Maybe someone is about to leave your pricing page because they can’t find the information they need.
- Maybe a returning visitor has a question before signing up.
- Or maybe a customer abandons your checkout without telling you why.
Instead of making assumptions, you can ask the right question at the right time and use real feedback to improve conversions.
For example, A visitor is about to leave your pricing page without signing up.
A microsurvey asks, “What’s stopping you from getting started today?” and gives you feedback you wouldn’t get from analytics alone.
What You’ll Get in TruConversion Microsurveys
- Page Load Trigger: Display a microsurvey as soon as a page loads. Capture first impressions before visitors interact with your content.
- Scroll Trigger: Show a survey after visitors scroll to a specific point. Ask for feedback once they’ve viewed enough of the page.
- Direct Visitor: Display surveys directly to visitors while they’re browsing. Collect feedback without interrupting their experience.
- Share Microsurvey: Share microsurvey reports with teammates or clients. Everyone can review the same responses and insights.
- CRM/ESP Integration: Send survey responses directly to your CRM or email marketing platform. Keep customer feedback connected with your existing tools.
- Remove Branding: Remove TruConversion branding from your microsurveys. Create a more consistent experience for your visitors.
- Delayed Trigger: Display a survey after a set amount of time. Give visitors time to explore before asking for feedback.
- Target Return Visitor: Show surveys only to returning visitors. Gather insights from people who are already familiar with your website.
- Multi-page Consumption: Display surveys after visitors browse multiple pages. Learn more from engaged users who have explored your site.
- Exclude Browser: Prevent surveys from appearing in selected browsers. Avoid collecting feedback where it’s not needed.
- Insert Own Branding: Add your own logo and branding to microsurveys. Keep the survey experience consistent with your website.
- Abandon Page Trigger: Show a survey when visitors are about to leave the page. Find out why they didn’t convert before they exit.
- Referral Visitors: Target visitors who arrive from referral websites. Understand how referral traffic experiences your site.
- Search Engine Referrals: Display surveys to visitors coming from search engines. Learn whether your content matches their search intent.
- Identity Targeting: Show surveys to specific visitors based on their identity or customer data. Deliver more personalized questions to the right audience.
Microsurvey Filters
- Date Range: View microsurvey responses from a specific time period. Compare feedback before and after making changes.
- Page URL: Filter responses from a specific page. Focus on the pages where you want more insights.
- Device: Analyze survey responses by desktop, tablet, or mobile users. Understand how feedback differs across devices.
- Browser: Filter responses by browser. Compare feedback from Chrome, Safari, Firefox, Edge, and more.
- Operating System: View responses by operating system. Discover whether different platforms affect visitor experience.
- Country: Analyze feedback from visitors in different countries. Compare opinions across your target markets.
- Campaign: Filter responses from a specific marketing campaign. Measure the quality of campaign traffic.
- Operating System Version: View responses by OS version. Identify issues affecting visitors on specific software versions.
- City: Analyze feedback from visitors in a particular city. Understand how local audiences respond.
- Browser Version: Compare responses by browser version. Spot issues affecting users on outdated browsers.
- Locale: Filter survey responses by language or regional settings. Ensure your website performs well for international visitors.
- Screen Width: Analyze responses across different screen widths. Check whether layout affects visitor feedback.
- Screen Height: Filter responses by screen height. Understand how different displays influence the user experience.
- Search Engine: View responses from visitors arriving through different search engines. Compare the quality of search traffic.
- Search Keywords: Analyze feedback based on the keywords visitors searched before landing on your website. Learn which search intent leads to the best user experience.
What Are Surveys in TruConversion?
Surveys in TruConversion help you collect detailed feedback from visitors throughout their journey.
Instead of relying only on behavior data, you can ask customers directly about their experience, expectations, and reasons for taking or not taking action.
The real value isn’t collecting more survey responses. It’s understanding what visitors are thinking.
- Maybe customers can’t find the information they need before making a purchase.
- Maybe they leave your website because pricing isn’t clear.
- Or maybe they have suggestions that could improve the overall experience.
Instead of making assumptions, you can ask targeted questions and use real feedback to improve your website.
For example, a customer completes a purchase and immediately sees a short survey asking, “What almost stopped you from buying today?”
Their answer highlights an issue you can fix to improve future conversions.
What You’ll Get in TruConversion Surveys
- Page Load Trigger: Display a survey as soon as a page loads. Capture feedback while the experience is still fresh.
- Scroll Trigger: Show a survey after visitors scroll to a specific point. Ask for feedback once they’ve engaged with your content.
- Share Survey: Share survey reports with teammates or clients. Everyone can review responses and collaborate on improvements.
- Remove Branding: Remove TruConversion branding from your surveys. Create a seamless experience that matches your website.
- Delayed Trigger: Display surveys after a set amount of time. Give visitors enough time to explore before asking questions.
- Insert Own Branding: Add your own logo and branding to surveys. Keep the survey experience consistent with your brand.
- Abandon Page Trigger: Display a survey when visitors are about to leave the page. Find out why they didn’t complete their goal before they exit.
Survey Filters
- Date Range: View survey responses from a specific time period. Compare feedback before and after making website changes.
- Page URL: Filter responses from a specific page. Focus on the pages where you want deeper insights.
- Device: Analyze survey responses by desktop, tablet, or mobile users. Understand how feedback differs across devices.
- Browser: Filter responses by browser. Compare feedback from Chrome, Safari, Firefox, Edge, and more.
- Operating System: View responses by operating system. Identify whether different platforms affect the visitor experience.
- Country: Analyze feedback from visitors in different countries. Compare responses across your target markets.
- Campaign: Filter survey responses from a specific marketing campaign. Measure the quality of campaign traffic.
- Operating System Version: View responses by OS version. Identify issues affecting visitors on specific software versions.
- City: Analyze feedback from visitors in a particular city. Understand how local audiences respond.
- Browser Version: Compare responses by browser version. Spot issues affecting users on outdated browsers.
- Locale: Filter survey responses by language or regional settings. Ensure your surveys work well for international audiences.
- Screen Width: Analyze responses across different screen widths. Check whether layout affects the visitor experience.
- Screen Height: Filter responses by screen height. Make sure surveys display correctly on different screen sizes.
- Search Engine: View responses from visitors arriving through different search engines. Compare the quality of search traffic.
- Search Keywords: Analyze feedback based on the keywords visitors searched before landing on your website. Learn which search intent leads to the best visitor experience.
Conclusion
More traffic doesn’t automatically mean more conversions. You need to understand what visitors do after they land on your website.
That’s exactly what TruConversion helps you do. It replaces guesswork with real user behavior, so you can make changes that actually improve results.
Whether you’re optimizing an online store, SaaS product, or lead generation site, everything you need is in one platform. Heatmaps, recordings, funnels, forms, and surveys work together to uncover conversion opportunities.
The standard pricing starts at $49/month (around $41/month when billed annually). But you don’t have to commit to a monthly subscription.
TruConversion is currently available as a lifetime deal on AppSumo with a one-time payment. I don’t know how long the deal will stay live, so if it’s still available, this is a great opportunity to secure lifetime access.
** FAQ **
1. Can I use TruConversion alongside Google Analytics?
Yes. Google Analytics tells you what happened, while TruConversion helps explain why it happened. Using both together gives you a complete picture of your website’s performance, from traffic sources to visitor behavior.
2. Which TruConversion feature should I start with first?
If you’re new to conversion optimization, start with Heatmaps and Session Recordings. They quickly reveal where visitors get stuck, so you can make simple improvements before exploring Funnels, Forms, or Surveys.
3. How much website traffic do I need before TruConversion becomes useful?
You don’t need thousands of daily visitors. Even with a few hundred monthly visitors, recurring behavior patterns can emerge, giving you enough data to identify usability issues and test improvements.
4. Can TruConversion help improve mobile conversions?
Yes. You can filter visitor behavior by device, operating system, screen width, and browser to see how mobile users interact with your website. This makes it easier to fix issues that only affect smartphones or tablets.
5. What should I do after finding a problem in TruConversion?
Don’t try to fix everything at once. Prioritize one issue with the biggest impact, such as a hidden CTA, a confusing form, or a high-drop-off funnel step; make the change, then monitor the results before moving on to the next optimization.
One small request before you go:
If you find that the Truconversion AppSumo lifetime deal has ended, please let me know in the comments. I’ll update this article as soon as possible so future readers don’t end up with outdated pricing information.
Also, share my article on your social media and your opinion in the comment box, whether it’s good or bad; It will inspire me to produce more articles.